
January is a good month to buy stocks. Maybe not last January. But January in general. Why’s that? Well, one of the reasons put forward is that January corrects the December sell-off. Whence the sell-off in December? Well, if you are a US investor you can realize a tax loss when you sell your losing stocks at the end of the year. And then you buy them back in January. Simple as that.
Reports of the January Effect are not limited to countries where capital gains are taxed. It’s also spotted in Belgium, for example. Now Americans, before y’all come rushing in with your big bucks and other big things, be aware that capital gains are about the only source of income that isn’t taxed in this homely country by the North Sea, with its infinite supply of fresh water falling down from the sky. The working Belgian has held the world record in the category ‘income tax’ for years, leaving the rest of the competition far behind.
Wealth, being much more mobile than labor, has managed to escape the grabby hands of our nation’s leaders so far, but now that wealthy French nationals are fleeing anti-capitalist persecution in their home country, even applying for Belgian citizenship (the French, of all people!), chances are Belgium is finally going to address the French challenge to its global leadership in the area of fiscal oppression policy. Sorry, I’m digressing.
As I was saying, the January Effect also exists in Belgium. With the capital gains tax explanation ruled out, we need another one. For example, many Belgians are paid an extra month’s salary in December or January, which we don’t spend on Christmas presents or ski vacations, but invest in the stock market. The Belgian financial newspaper De Tijd (“The Time”), which won the 2012 European Newspaper award (admittedly having the advantage that most members of the jury don’t understand Dutch), looked at 20 years of Belgian stock market returns, and proved beyond reasonable doubt that “on average, the Brussels stock market performs better in January than in the other months of the year”).
You can forgive a reporter, even a reporter of a financial newspaper, for not complying with the rigorous standards of scientific inquiry, but the methods De Tijd applies and the conclusions it draws are so extravagant that this piece of “research” belongs firmly to the Cargo Cult Finance category of Quixotic Finance.
Ilse De Witte, author of the article, reports an average return of 0.8% for the month of January in the years 1993-2013. I wonder if she would have rounded to 1 decimal (in her comments; the table on the same page does show 2 decimals) as well if the return, rounded to two decimals, had been 0.74% rather than 0.76%. Yes, that’s right, 0.76%. Not exactly a reason to sell your bonds, empty your money account and pour your money all over the stock market. And then do the opposite at the end of January. 0.76%. You’d better make sure your stock broker is really cheap.
Strictly speaking, De Witte is right: the average monthly return of the BEL20 index across all 12 months was 0.50%. 0.76% is more than 0.50%, quod erat demonstrandum. That’s what Wall Street pros call a difference of 26 basis points (probably just another way to make small numbers sound more impressive).
But the rounding to one decimal is nothing compared to De Witte’s next trick to make the January Effect more significant than it really is. It’s a trick well known by unscrupulous asset managers trying to exaggerate their performances. And it’s for a good reason such dishonest practices are banned by the industry’s GIPS standards (Global Investment Performance Standards, “establishing a broadly accepted ethical standard for calculating and presenting investment performance based on the principles of fair representation and full disclosure”).
According to GIPS rule 5.A.4,
Returns for periods of less than one year MUST NOT be annualized. (emphasis in original)
Reason is that annualization blows up meaningless short-term returns into seemingly highly significant ones. De Witte presents January’s average of 0.76% as 9.49% on an annual basis (using monthly compounded returns). (I have 9.51% in my calculations, but I don’t want to split hairs.) That should be contrasted with 7.64%, namely the average of the BEL20’s yearly returns in the same period. I can forgive De Witte for mixing up arithmetic averages and compound returns, but not for the suggestion that you can invest in January during the whole year.
Now these are all common mistakes for people with no training and little experience in performance analysis. But what I’m about to reveal will shock even the readers who don’t give a damn about mathematical rigor. De Witte – or the person who did the research for her – must have recorded all monthly performances in the 20-year sample, at least that’s what you would expect. I did the same thing for you, dear reader, please have a look at this table:
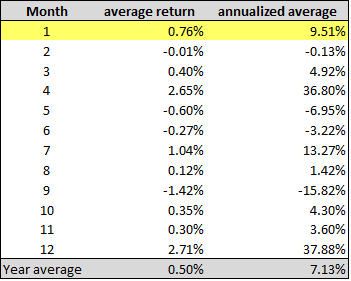
As said, the average monthly return (last row in the table) across all months was 0.50%. January’s average (highlighted) was 0.76%. But unless you cover the rest of the table with an opaque object, not allowing yourself to have even a casual look at the other months, you can’t help noticing that, hey, what’s so special about January?? It seems the April Effect and December Effect are much, much stronger. For example, the average return in December was 2.71%, or 37.88% if there were twelve December months in each year. And what curse is responsible for making September such a miserable month?
Interestingly, De Witte quotes a stock analyst who observes that “January’s winning stocks tend to be last year’s losers”, a phenomenon he attributes to a ‘window dressing’ effect comparable to the sell-in-December, buy-in-January explanation for the US, as I discussed in the introduction. It’s unclear whether the analyst’s observation is only valid for small- and mid-caps, which are also discussed in the same article, or for the whole Belgian stock market. In the latter case, the fact that the data show December to be the best month does not provide much support for the sell-in-December, buy-in-January story.
So, what explanation do we have for the April, September and December Effect? I’m sure any behavioral finance adept worth his stripes can come up with a, sorry, many superficially plausible explanations, but being a bit challenged on the imaginative side since I stopped taking acid, I’ll stick to some good old-fashioned and inside-the-box statistical analysis:
Grand average return (all months): 0.50%
Monthly standard deviation: 4.88%
Maximum average: 2.71% (December)
or less than 1 standard deviation from the grand average.
Wake me up when you find a month with an average return of 6%.
To add some rigor to my argument, I ran a one-way 1 ANOVA test. One-way ANOVA (Analysis-Of-Variance) checks if there are months whose average returns differ significantly from the grand average of 0.50%, given the amount of variation in those monthly returns. This is the result:
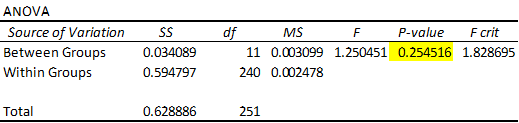
The high p-value (it should be lower than 0.05 to indicate something unusual) wraps it up: all noise, no signal (I debunked another spurious calendar effect using ANOVA in an earlier post).
So much for Belgium’s January Effect. But what about the US? It seems it disappeared there too, shortly after it was discovered. That happens quite a lot with calendar or other anomalies.
Anomalies are popular in behavioral finance circles. They are often put forward as yet another proof that markets are inefficient. Quite ironic, in fact, if you know that those people revere Daniel Kahneman (of Nobel fame) & the late Amos Tversky. Kahneman and Tversky (K&T)’s pioneering work on human biases is often considered as laying the ground for the immensely popular field that behavioral finance has become. I wonder how many of K&T’s fans actually read their work.
In their first jointly-written paper, Belief in The Law of Small Numbers (1971), K&T showed how persistent our tendency is to mistake chance results for something significant. The illusion of pattern, if you wish. Incidentally, many behavioral finance fans are equally oblivious to the fact that K&T never drew the fatalistic conclusion that nothing we do can help us conquer our inclination toward seeing patterns in pure randomness. Quite the contrary; as they pointed out, the whole point of probability theory and statistics is to arm us against these all too human fallacies (see also my earlier post dispelling other myths about K&T).
The fact that many anomaly-mongerers embrace Daniel Kahneman 2 as their patron saint must be the biggest historical mistake since religious apologists laid claim to Einstein’s support. The greatest scientist of the 20th century was so careless as to let the G-word slip into a couple of his famous quotes, which provided the perfect excuse for quote-miners to ignore what Einstein actually said or wrote about religion when he wasn’t merely speaking metaphorically.
People can be irrational? Certainly, but hardly a reason to take statistical anomalies (alleged or real) at face value, much less as evidence of irrational markets. That would be irrational.